Medical Design
Recent
Recent
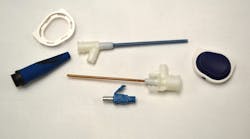
Courtesy C&J Industries
ID 75048250 © Gennady Kurinov | Dreamstime.com


293237501 © Pongpon Wandee | Dreamstime.com


Highlights
Highlights
109336976 © Sergiy Palamarchuk | Dreamstime.com

107862260 © Rclassenlayouts | Dreamstime.com


109336976 © Sergiy Palamarchuk | Dreamstime.com

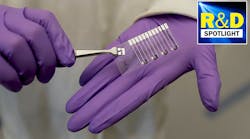
Images courtesy of Lori Sanders/Harvard SEAS, source via Harvard’s Wyss Institute
Courtesy Protolabs

7507056 © Cornelius20 | Dreamstime.com

68665429 © Onion | Dreamstime.com


Members Only Content
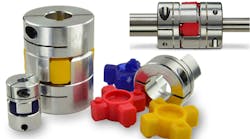
Ruland Manufacturing Inc.
201751699 © Val_th | Dreamstime.com

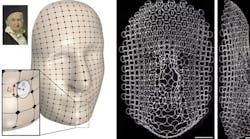
Purdue Research Foundation photo/Jennifer Mayberry